Germany’s electricity grit
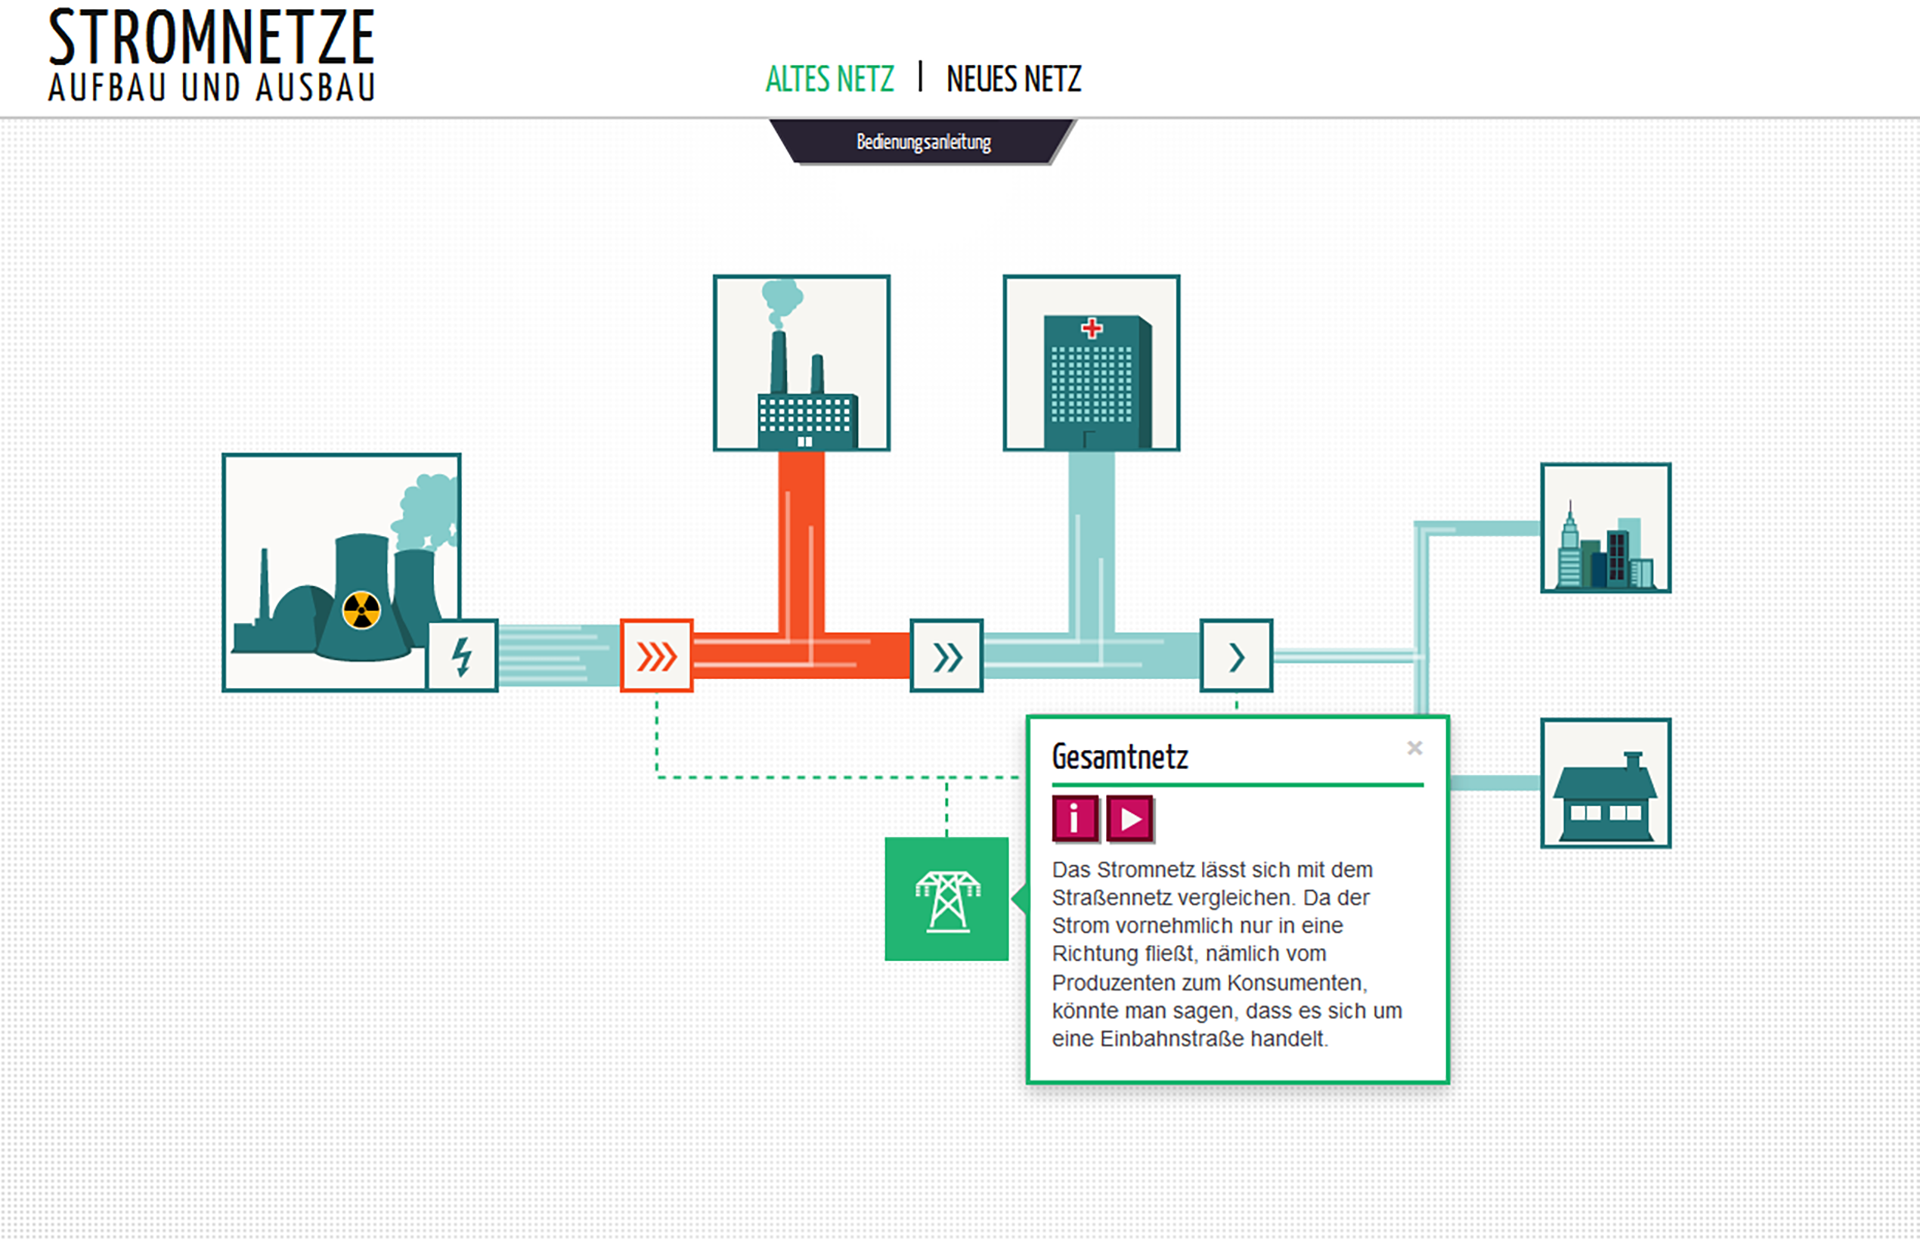
For the German Nagelschneider foundation in cooperation with the German non-profit /e-politik.de/ e.V., edeos has produced a complex interactive infographic. The infographic explains how the German electricity grid works and how it has to be amended in order to meet the demands of the German energy transition. The infrastructure and actors of the electricity grids are symbolized by icons. If the user selects an icon, an information box opens and offers additional information about the topic, about its problems. The main topics are visualized with animated video content (about 10 minutes of video in total). The infographic is optimized for use with tablets and other touch screens. It is based on a modified WordPress system and can be maintained easily even by persons with just beginners knowledge of content management systems. The aim of the project was to explain the complex topic multidimensionally and detailed, but simple and motivating for interested laymen. The architecture of the infographic is constructed in a way which makes it very intuitively to use. There are different layers of information with an increasing depth of information. This allows the user, depending on its motivation, to access the topic as in-depth as he wishes. Social, political and technical challenges of the amendment of the electricity grid are also presented.
(Deutsch) Das Projekt
(Deutsch) Für die Stiftung Nagelschneider und den Verein /e-politik.de/ e.V. hat edeos eine komplexe interaktive Infografik produziert. Die Infografik erklärt den Ausbau des Stromnetzes im Zuge der Energiewende. Die Infrastruktur und Akteure der Stromnetze sind mit Icons symbolisiert. Wählt der Nutzer ein Icon an, öffnet sich ein Infofeld, das je nach Symbol weitere Zusatzinfos, Problemfelder und/oder Videos anbietet.
(Deutsch) Der Inhalt
(Deutsch) Der Anspruch des Projektes war es, das komplexe Themenfeld mehrdimensional und detailliert aber einfach und motivierend für interessierte Laien aufzubereiten. Die Architektur der Infografik ist deshalb so aufgebaut, dass sie möglichst intuitiv genutzt werden kann. Die Informationsebenen sind hintereinander gelagert, mit zunehmender Informationstiefe.
So kann der Nutzer je nach Motivation beliebig detailliert in die Themen einsteigen kann. Gesellschaftliche Debatten, die das Thema aufwirft, werden dabei aufgenommen und kontrovers dargestellt.
(Deutsch) Die Technik
(Deutsch) Die wichtigsten Themen sind mit Animationsvideocontent aufbereitet (insgesamt etwa 10 Minuten Videomaterial). Die Infografik ist für die Nutzung mit Tablet/ Touchscreen optimiert, basiert auf einem modifizierten WordPress System und kann selbst mit CMS Kenntnissen auf Anfängerniveau einfach gepflegt und inhaltlich geändert bzw. ergänzt werden.


